用python绘制本征函数系拟合图
来自数理方法作业12附加题5。
用本征函数系拟合两个特定函数
这里仅列出最终计算结果。
本征函数系1
对于本征函数系
其正交归一性:
令
- 当
,有
- 当
,有
本征函数系2
对于本征函数系
其正交归一性:
令
- 当
,有
- 当
,有
本征函数系3
对于本征函数系
其正交归一性:
令
- 当
,有
- 当
,有
用python绘制拟合图
编写程序
用python脚本根据参数l、n绘制出
py
import numpy as np
import matplotlib.pyplot as plt
from matplotlib.backends.backend_tkagg import FigureCanvasTkAgg
import tkinter as Tk

# ---------------------------------------------------
# 参数
l = 10              # 函数f自变量范围
ns = [1,5,20,200]    # 分别用前ns[0],ns[1],...项进行拟合
alpha = 0.6         # 绘图曲线透明度

# ---------------------------------------------------
# 待拟合函数及其字符串
## 待拟合函数1
def fx1(x, l):
    return 0 * x + 1
str_fx1 = 'f(x)=1'
## 待拟合函数2
def fx2(x, l):
    return - x * x + l * x
str_fx2 = r'$f(x)=-x^2+lx$'

# ---------------------------------------------------
# 本征函数系字符串
str_base1 = r'$X_n(x)=\sin\frac{n\pi}{l}x$'
str_base2 = r'$X_n(x)=\sin\frac{2n+1}{2l}\pi x$'
str_base3 = r'$X_n(x)=\cos\frac{n\pi}{l}x$'

# ---------------------------------------------------
# 用前n项进行拟合
## 用本征函数系1拟合函数1
def fit11(n, x, l):
    y = x * 0
    for i in range(1, n+1):
        y += 2 / (i * np.pi) * (1 - (-1)**i) * np.sin(i * np.pi * x / l)
    return y
## 用本征函数系1拟合函数2
def fit12(n, x, l):
    y = x * 0
    for i in range(1, n+1):
        y += 4 * l**2 / (i**3 * np.pi**3) * (1 - (-1)**i) * np.sin(i * np.pi * x / l)
    return y
## 用本征函数系2拟合函数1
def fit21(n, x, l):
    y = x * 0
    for i in range(0, n+1):
        y += 4 / ((2 * i + 1) * np.pi) * np.sin((2 * i + 1) / (2 * l) * np.pi * x)
    return y
## 用本征函数系2拟合函数2
def fit22(n, x, l):
    y = x * 0
    for i in range(0, n+1):
        y += 8 * l**2 / ((2 * i + 1)**2 * np.pi**2) * (4 / ((2 * i + 1) * np.pi) - (-1)**i) * np.sin((2 * i + 1) / (2 * l) * np.pi * x)
    return y
## 用本征函数系3拟合函数1
def fit31(n, x, l):
    y = x * 0
    for i in range(0, n+1):
        if i == 0:
            y += 1
        else:
            y += 0
    return y
## 用本征函数系3拟合函数2
def fit32(n, x, l):
    y = x * 0
    for i in range(0, n+1):
        if i == 0:
            y += l**2 / 6
        else:
            y += -2 * l**2 / (i**2 * np.pi**2) * (1 + (-1)**i) * np.cos(i * np.pi / l * x)
    return y

# ---------------------------------------------------
# 绘制用前ns=[n1,n2,...]项拟合函数f,拟合公式为fit
#   ax: 绘制图像的子图(位置)
#   l: 函数自变量范围
#   ns: 列表[n1,n2,...]分别用前n1项、前n2项拟合
#   fx: 待拟合的函数
#   str_fx: 待拟合函数字符串
#   fit: 用前n项进行拟合的函数
#   alpha: 透明度
#   str_base: 用于拟合的本征函数系字符串
def ax_fit(ax, l, ns, fx, str_fx, fit, alpha, str_base):
    x = np.linspace(0, l, 1000)
    # 绘制待拟合的函数
    f1 = fx(x, l)
    ax.plot(x, f1, label=str_fx, alpha=alpha)
    # 绘制分别用前n1项、前n2项、...拟合的函数
    for n in ns:
        f2 = fit(n, x, l)
        ax.plot(x, f2, label=f'n={n}', alpha=alpha)
    # 绘制图注
    ax.set_title(str_base)
    ax.legend()

def rplot():
    # ---------------------------------------------------
    # 接受参数
    l = float(l_input.get())
    str_n = str(n_input.get()).split(',')
    ns = []
    for n in str_n:
        ns.append(int(n))
    alpha = float(alpha_input.get())
    # ---------------------------------------------------
    # 初始化画布和子图
    fig.clf()
    ax1 = fig.add_subplot(231)
    ax2 = fig.add_subplot(234)
    ax3 = fig.add_subplot(232)
    ax4 = fig.add_subplot(235)
    ax5 = fig.add_subplot(233)
    ax6 = fig.add_subplot(236)
    # ---------------------------------------------------
    # 利用绘制函数进行绘制
    ax_fit(ax1, l, ns, fx1, str_fx1, fit11, alpha, str_base1)
    ax_fit(ax2, l, ns, fx2, str_fx2, fit12, alpha, str_base1)
    ax_fit(ax3, l, ns, fx1, str_fx1, fit21, alpha, str_base2)
    ax_fit(ax4, l, ns, fx2, str_fx2, fit22, alpha, str_base2)
    ax_fit(ax5, l, ns, fx1, str_fx1, fit31, alpha, str_base3)
    ax_fit(ax6, l, ns, fx2, str_fx2, fit32, alpha, str_base3)
    canvas.draw()

# ---------------------------------------------------
# 绘制gui界面
root = Tk.Tk()
root.title('fit')
# 绘制三个参数输入框
Tk.Label(root,text='l(函数自变量范围):').grid(row=1,column=0)
l_input=Tk.Entry(root)
l_input.grid(row=1,column=1)
l_input.insert(0,'10')
Tk.Label(root,text='n(用逗号分割数字):').grid(row=1,column=2)
n_input=Tk.Entry(root)
n_input.grid(row=1,column=3)
n_input.insert(0,'1,5,20,200')
Tk.Label(root,text='alpha(透明度):').grid(row=1,column=4)
alpha_input=Tk.Entry(root)
alpha_input.grid(row=1,column=5)
alpha_input.insert(0,'0.6')
Tk.Button(root,text='绘制',command=rplot).grid(row=1,column=6,columnspan=7)
# 设置画布
fig = plt.figure(figsize=(15, 9))
canvas = FigureCanvasTkAgg(fig, master=root)
canvas.draw()
rplot()
canvas.get_tk_widget().grid(row=0, columnspan=7)

Tk.mainloop()INFO
运行程序后图像底部有三个参数可以设置, 其中参数l是函数自变量的范围,即 10; 参数n是取本征函数系的前n项并分别绘制,默认为1,5,20,200; 参数alpha是绘制函数曲线的透明度,接受的数值大小 0.6 。
修改参数后点击绘制按键即可根据新参数重新绘图。
运行结果如下: 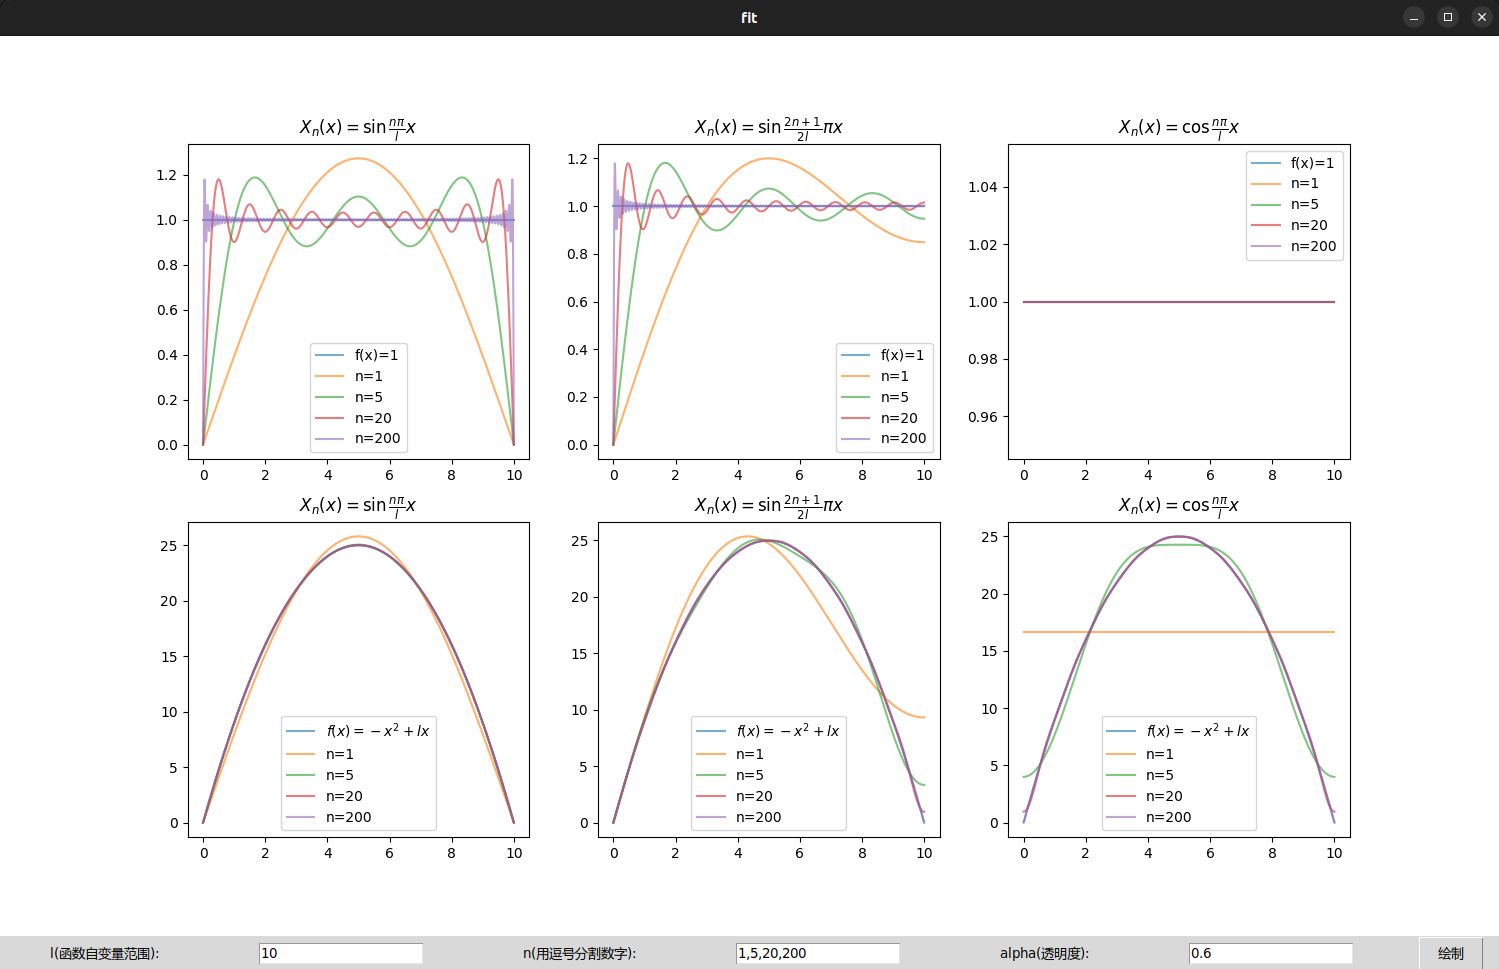
结论
通过设定不同的参数n,可以观察到分别用本征函数系的前
随着选取的项数n的增加,本征函数系函数级数