Observational Astronomy Course
There is note of lectures in CEFCA
lecture 1: basics
The basics of Observational Astronomy
The celestial sphere, coordinates and planning observations
great circle: whose diameter is alse a diameter of the sphere.
Equator: the great circle perpendicular to the axis of Earth's rotation
latitude (angle): positive towards the North, and negative towards the South
the circle of latitude: the small circle parallel to the Equator
longitude (angle): positive towards the East, and negative towards the West
meridian: any great circle perpendicular to the Equator
prime meridian: the meridian passing through the Royal Greenwich Observatory in the UK
celestial sphere
celestial sphere
celestial equator
the North and South celestial poles
coordinates
- Equatorial Coordinates: declination and right ascension
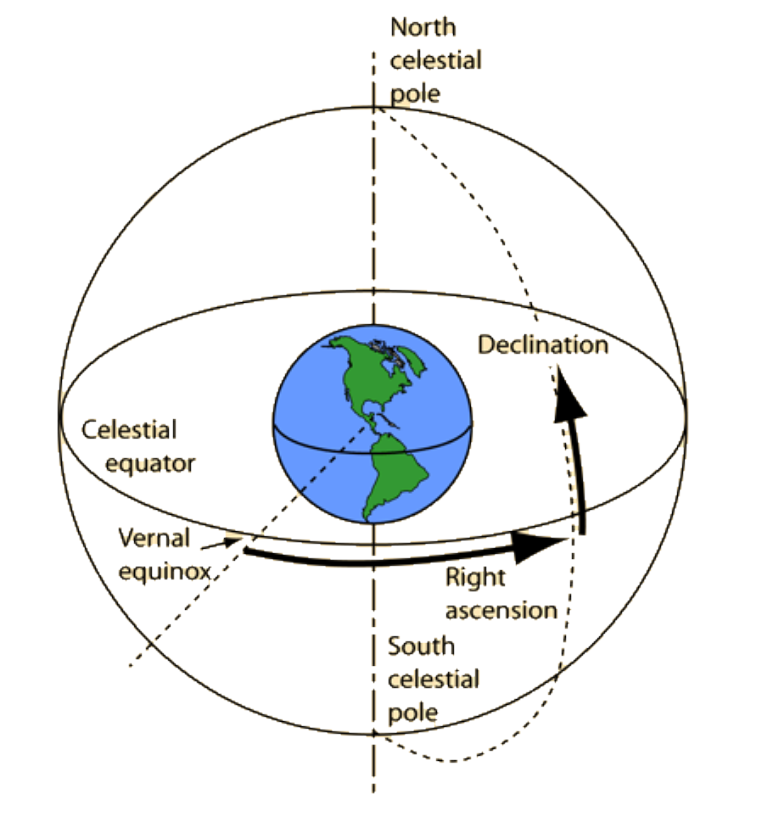
Declination (
or ): extension of latitude ecliptic: the plane of the Earth's orbit around the Sun
equinox points: ecliptic & celestial equator
Vernal/Spring equinox: March (the start point for measuring right ascension)
Autumn equinox: September
Right Ascension (
or ): extension of longitude only positive; given in hours (0-24) or degrees (
- ) zenith: the top of observers on the celestial sphere
Horizontal coordinates
Azimuth (Az) and Altitude (Alt)
Azimuth (N-E-S-W)
Altitude: runs from
at the horizon to at the zenith
planning observations
the staralt tool: https://astro.ing.iac.es/staralt/
Local Sidereal Time (LST): the right ascension of the local zenith
considerations:
- what is my desired altitude (Dec)
- how long do I want to observe (RA and Dec)
Telescopes and Mounts
telescopes
two types of telescopes:
- Refractors (use lenses)
- Reflectors (use mirrors)
- Newtonian (one mirror with optical power)
- Compact (two mirror with optical power)
basic definitions for optics:
- Focus/focal point
- focal length (
)
mounts
Equatorial (follow RA and Dec)
Altazimuthal (follow Az and Alt)
The GT80 - other parts of the telescope
the mount point of CCD:
- Nasmyth focal points
- Cassegrain focal points
- prime focus points
Field rotation: rotating the CCD counter clock-wise when looking East
lecture 2: CCDs
CCDs: Charge Coupled Devices
The basics of CCDs
Silicon (
): a semiconductor energy level band: the energy level overlap when number of atom gets large.
insulator & semiconductor & conductor
valence band: the last occupied energy band
conduction band: the energy bands above the valence band, where electrons can move freely.
Photoelectric effect: incoming photon can interact with an electron and transfer its energy.
if
, the electron can jump to the conduction band. for silicon,
or equivalently for optical wavelengths, not for NIR(Near infrared)
Quantum Efficiency: the ability of a CCD to "convert" an incoming photon into a (photo)electron.
photoelectrons: the electron interacted with photon
pixel: acts as a MOS capacitor
Metal - Oxide - Semiconductor
polysilicon -
- the potential well: trap the photoelectrons
Full Well Capacity: the maximum number of electrons that can be stored in the potential well
Blooming: the net effect of well capacity saturation on an astronomical image
only occurs in only one direction
the structure of CCD pixels:
the electrode triplet defines the pixel in one direction (here: vertical)
the other direction (here: horizontal) the pixels are delineated with insulator strips called channel stops
![]()
CCD linearity: during an exposure of time
a pixel gathers a total number of photoelectrons, and we have Readout:
charge transfer
charge measurement: measure voltage difference
charge digitisation: the final output value for a pixel is a digital integer value, called Analog-to-Digital Unit, or ADU
Analog-to-Digital Converter or ADC
the CCD gain is a quantity that defines "how many electrons are required to obtain one ADU"
Digital saturation: the ADC cannot represent the ADU counts exceed the value of
( ) for a standard 16-bit astronomical CCD.
Calibration frames
Bias: to avoid the digitise negative ADU values, a fixed bias voltage,
, is added when , ensuring that bias frames: a zero-time "integration"
Thermal electrons: some electrons can jump to the conduction band spontaneously due to their thermal energy. And they are indistinguishable from photoelectrons.
dark current: the amount of thermal electrons present in the CCD chip
cool it down to avoid it.
the dark current is described by a constant
that depends on the material and the temperature of the CCD, given in units of . The amount of dark current increases with the exposure time dark frames: an integration without exposing the chip to light. (notice that the dark frames includes the bias)
flat frames:
in order to correct:
- imperfections in the optical path (e.g. vignetting, dust motes etc)
- differences in pixel sensitivity over the whole chip
to obtain flat frames, simply points the telescope at the dusk or dawn twilight sky.
lecture 3: science
Doing science with our data
Basic definitions
Luminosity: the total amount of radiant energy emitted over all wavelengths per unit time in all directions, with the unit Watt
for a star, its luminosity is
where
the radius the effective temperature the Stefan-Boltzmann constant Brightness: how bright an object appears to be, as seen from Earth
Flux: for a star at distance
from the Earth, its flux is given by: Magnitude: just a number refer to the object's brightness. (apparent magnitude)
the large number means faint, while the small number means bright.
Define that "a star of magnitude 6 should be precisely 100 times fainter than a star of magnitude 1"
the magnitude equation:
Vega-magnitude scale: define the magnitude of Vega is zero (
)
Vega is the 5th brightest star in the sky.
AB-magnitude scale: AB means "absolute"
where
is the spectral flux density in a frequency interval : the magnitude in the V-band and the constant number, 48.6, ensures that
parallax:
An object with parallax of 1 arcsec is defined to be at a distance of 1 parsec (parallax second). (
) absolute magnitude: the apparent magnitude a star would have if located at a distance of 10 parsec
the equation of apparent magnitude
and absolute magnitude :
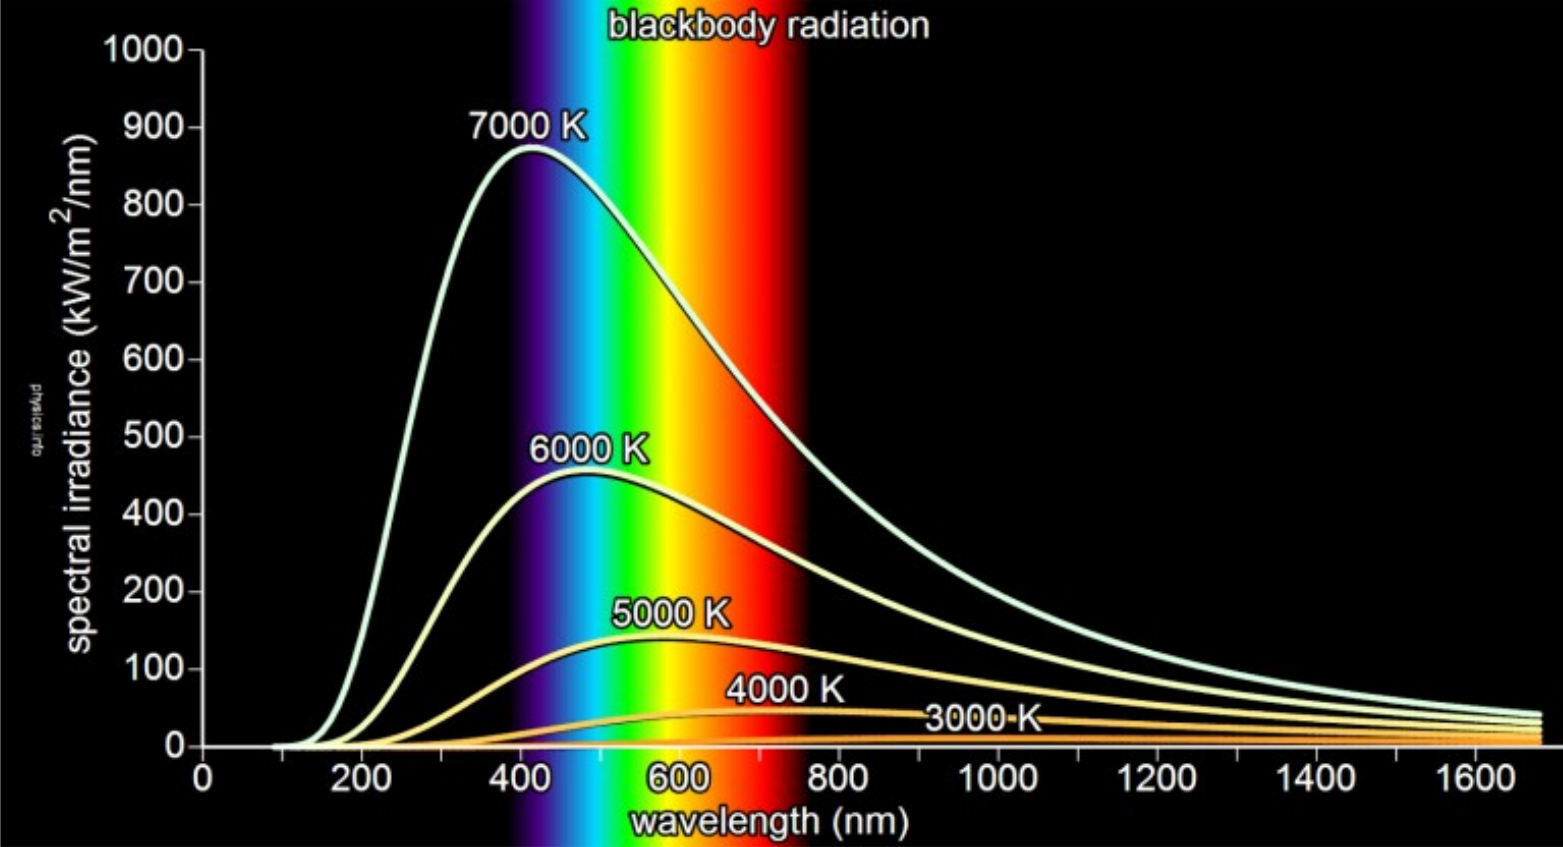
Introducing some Physics
Planck's Law: the emit radiation of black bodies:
the hot star looks blue, while the cool star looks red.
spectral lines:
e.g. the Hydrogen Balmer series
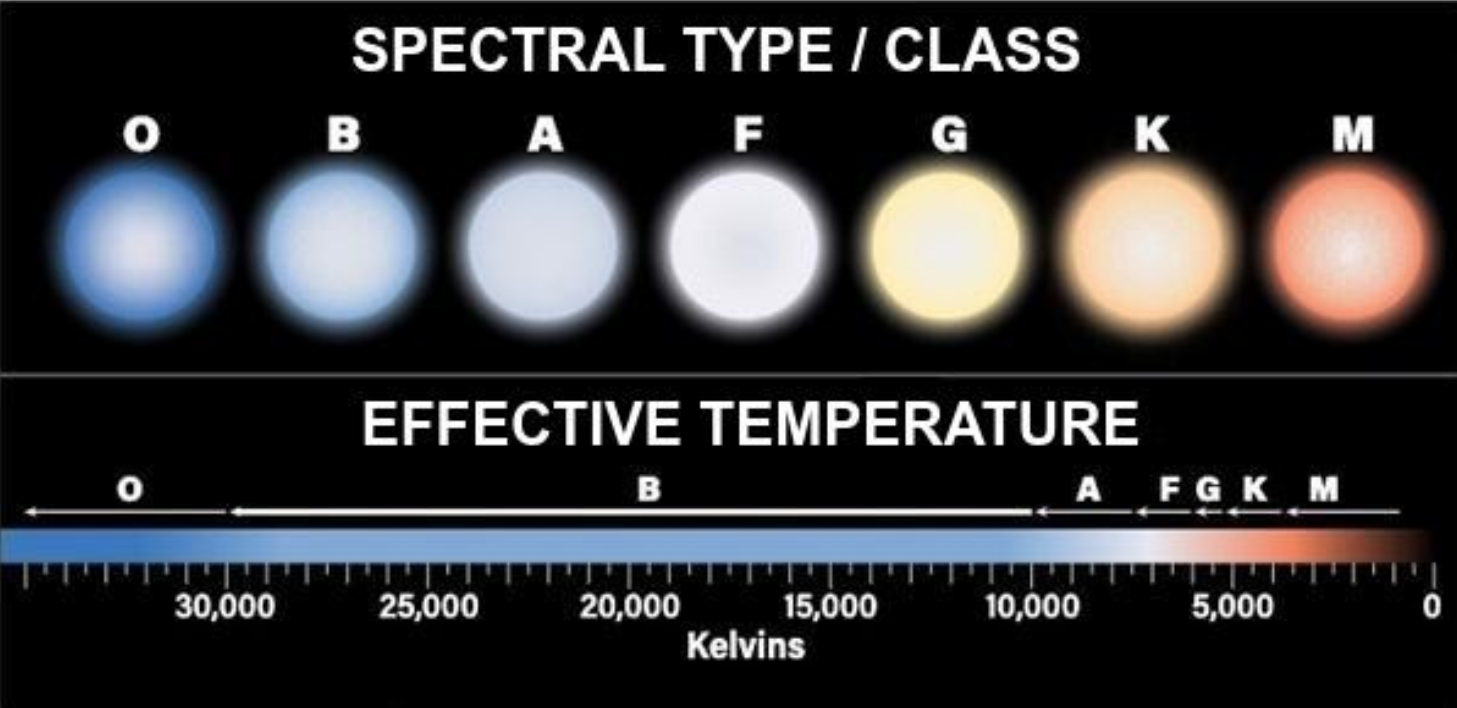
Spectral Classes:
7 spectral classes or types: O,B,A,F,G,K,M
each class is further sub-divided in 10 sub-classes from 0 to 9. Our Sun is a G2 star.
Spectral Energy Distrubtion (SED)
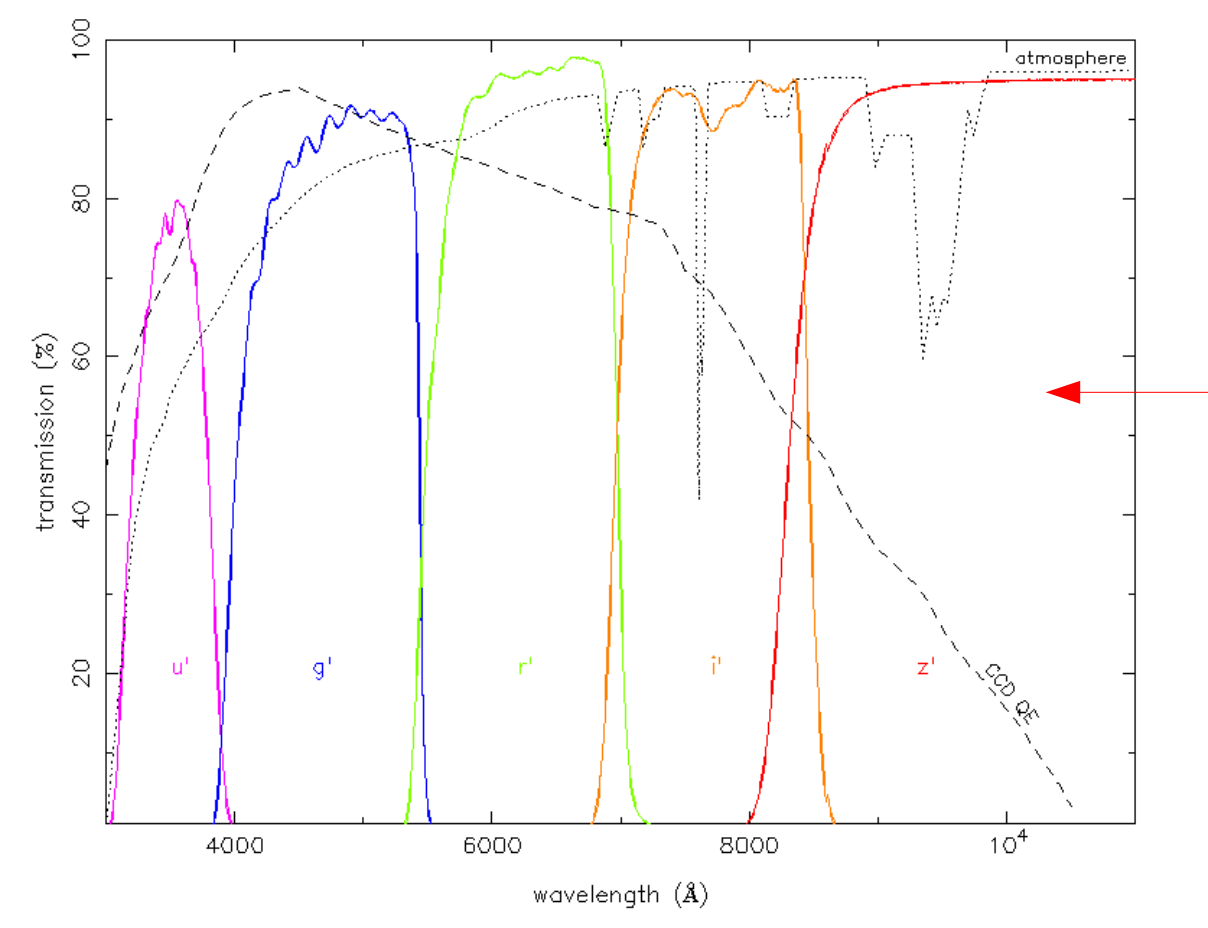
Filter
the Johnson UBVRI system
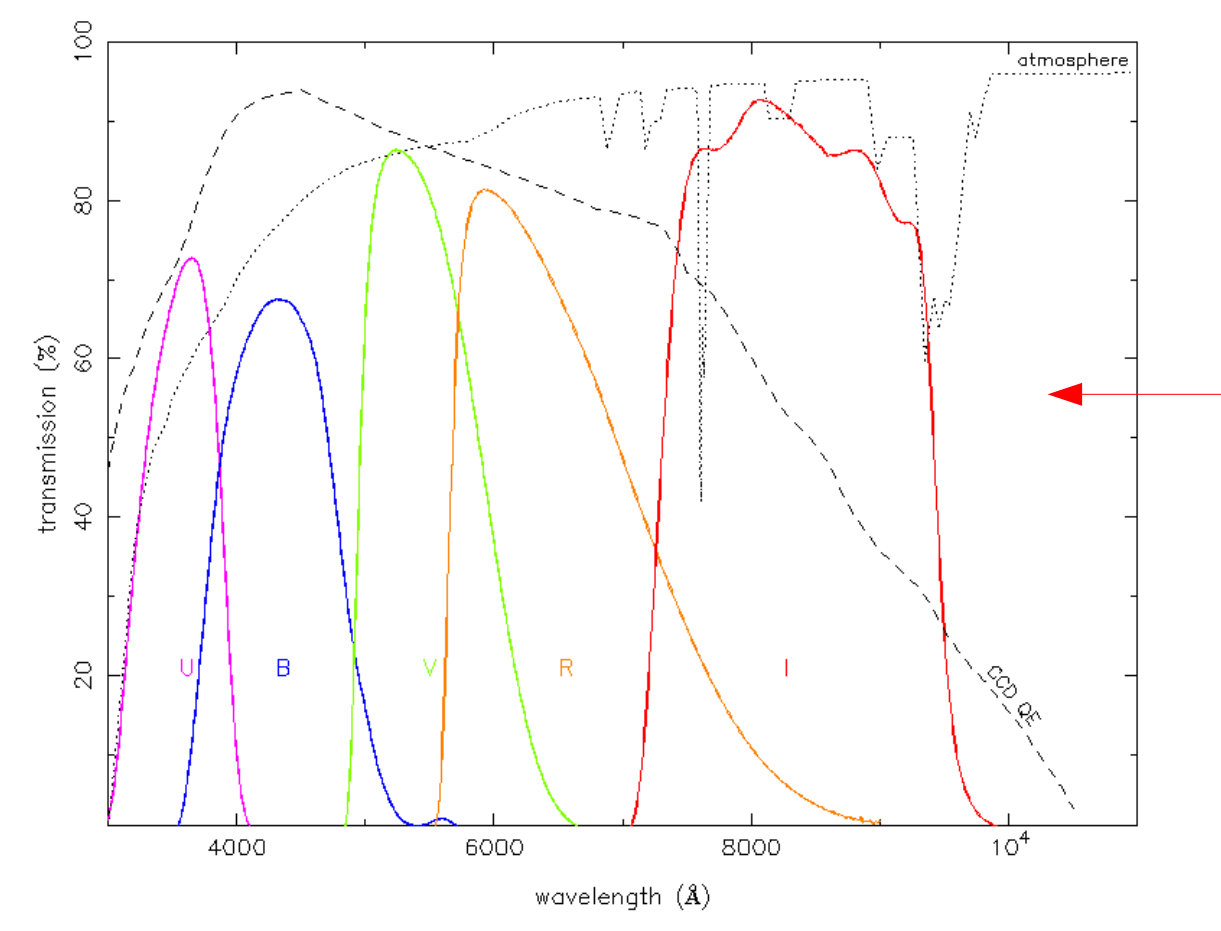
- the SDSS ugriz system
Color index:
for apparent magnitude in Johnson V for absolute magnitude in SDSS g for a star of magnitude 15 in the Johnson B-filter for a star of magnitude 19 in the SDSS r-filter Interstellar extinction and reddening
color excess:
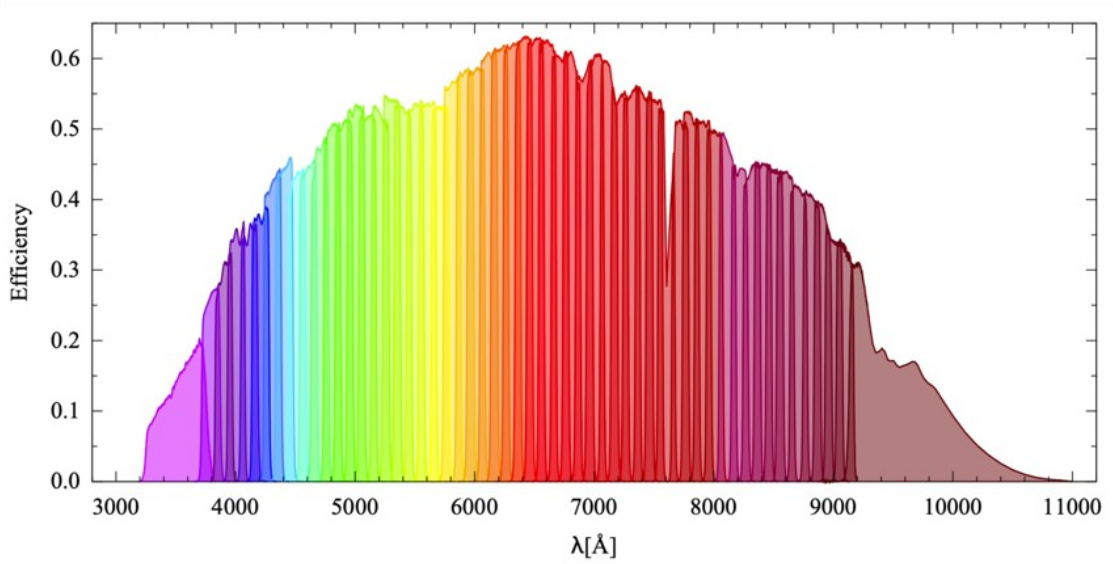
the J-PLUS filter system
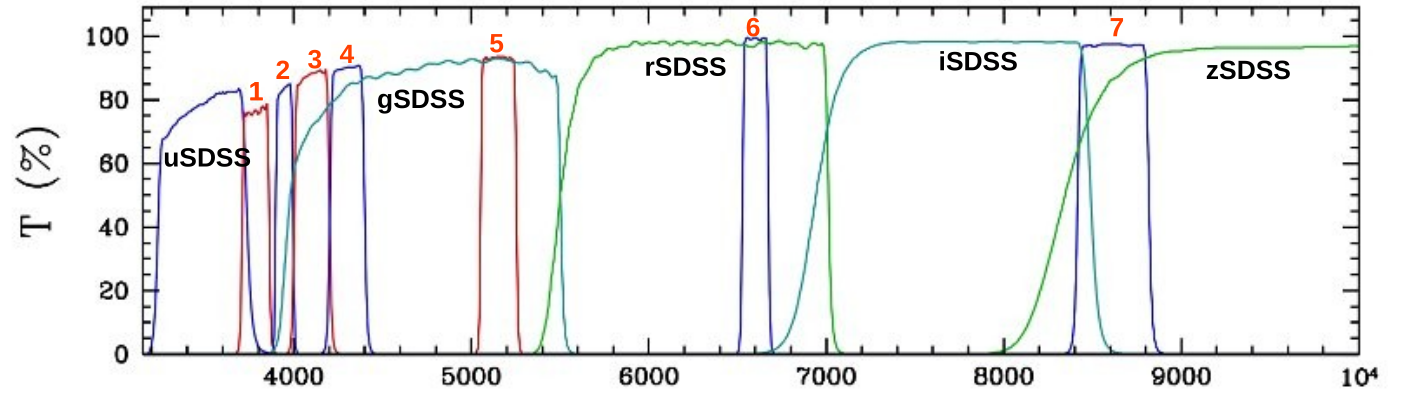
- the J-PAS filter system
Doing Science
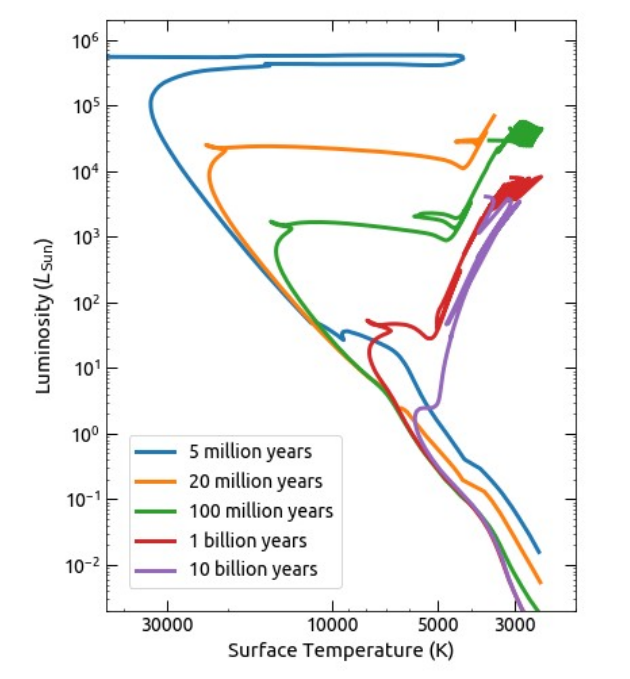
The Hertzsprung-Russell diagram (H-R)
The Main Sequence (MS): most time of stars' lives, steady nuclear fusion reactions in their cores, i.e. converting Hydrogen into Helium
giant branch:
- Red Giant Branch (RGB)
- Horizontal Branch (HB)
- Asymptotic Giant Branch (AGB)
white dwarf (WD)
constructing an H-R diagram:
- observed magnitude - observed color
- absolute magnitude - observed color
- absolute magnitude - intrinsic color
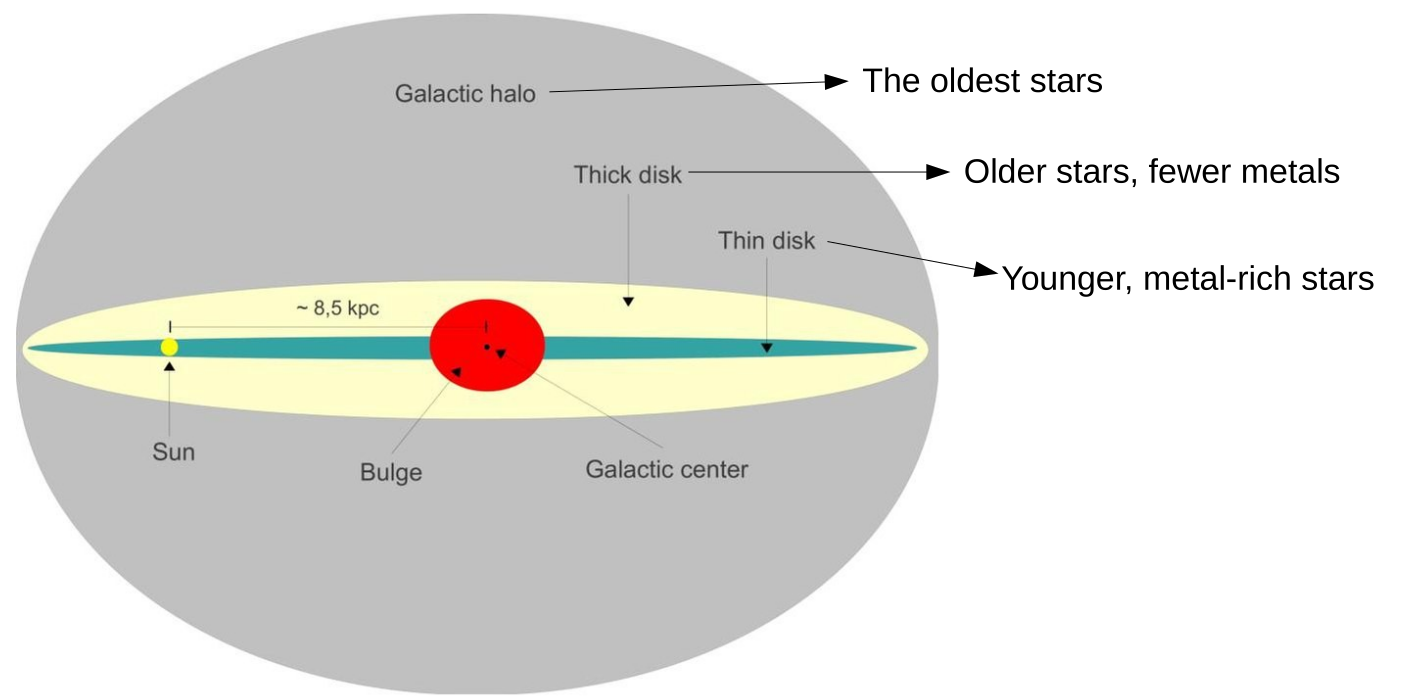
Anatomy of the Milky way
Clusters:
- Globular Clusters
- Open Clusters
Modelling the H-R diagrams of clusters: plot the isochrone
lecture 4: photometry
Data Reduction and Photometry
the basics of Data Reduction
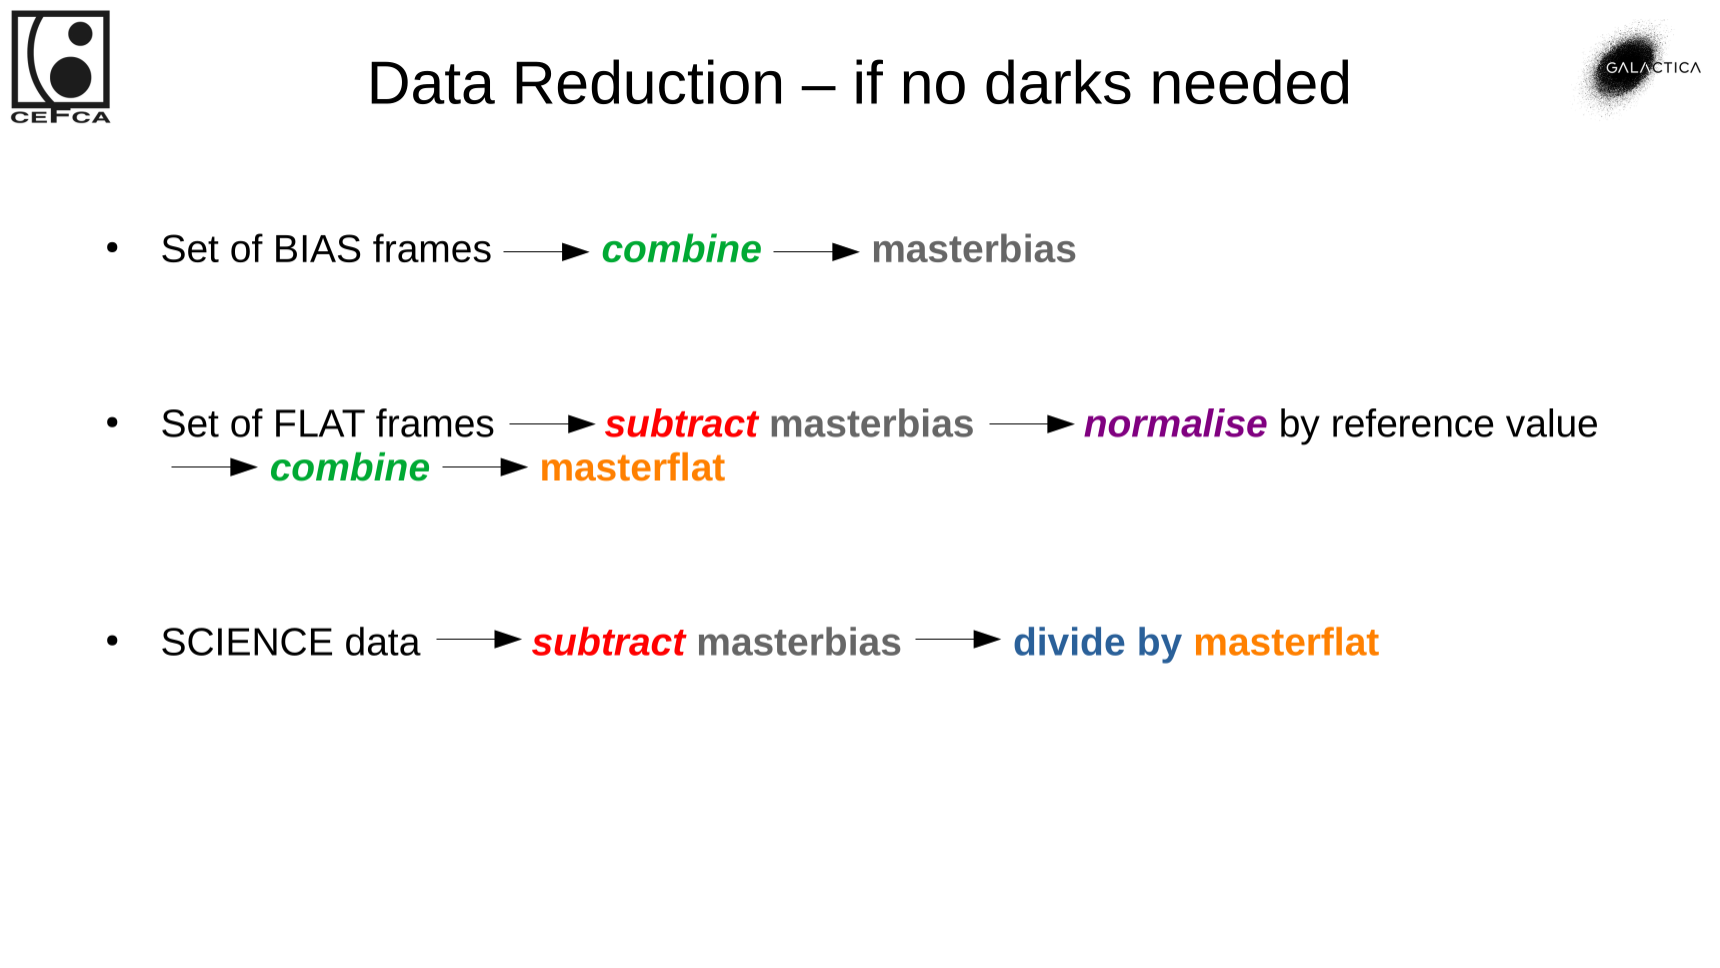
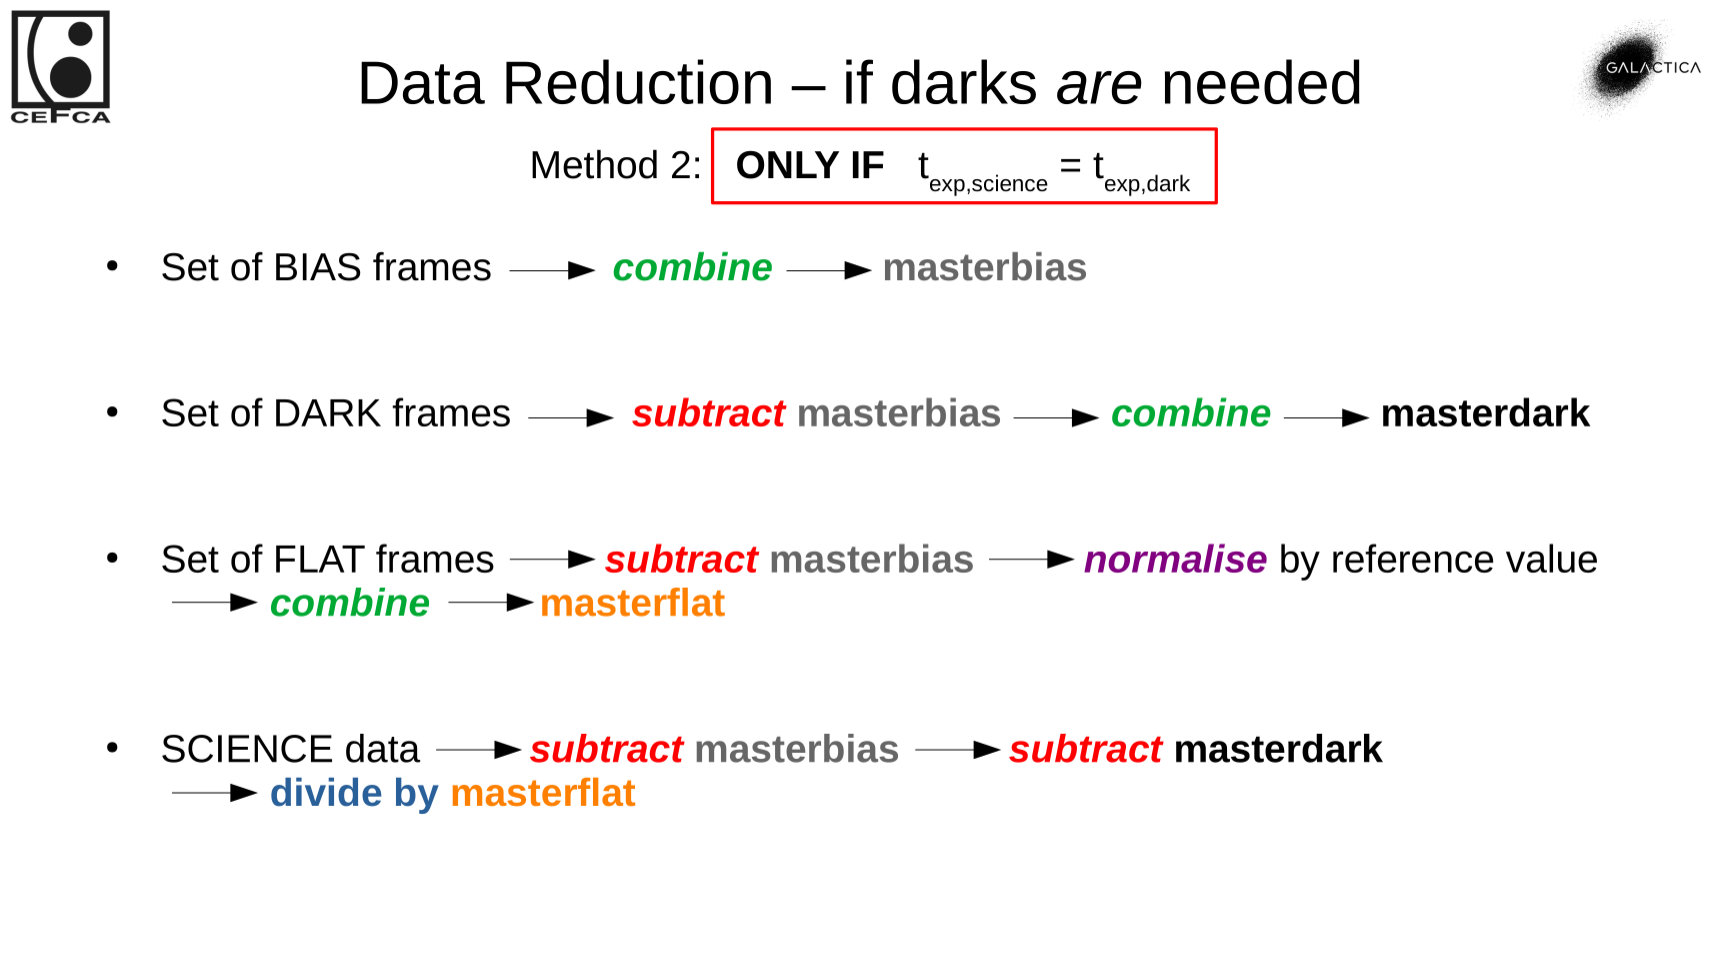
data reduction: remove unwanted signals and correct imperfections on the data using bias, dark and flat frames.
master frames: combine a series of frames, i.e. masterbias, masterdark, masterflat frames.
Combining Frames: average/mean or median
median is robust facing outliers. (take odd number frames)
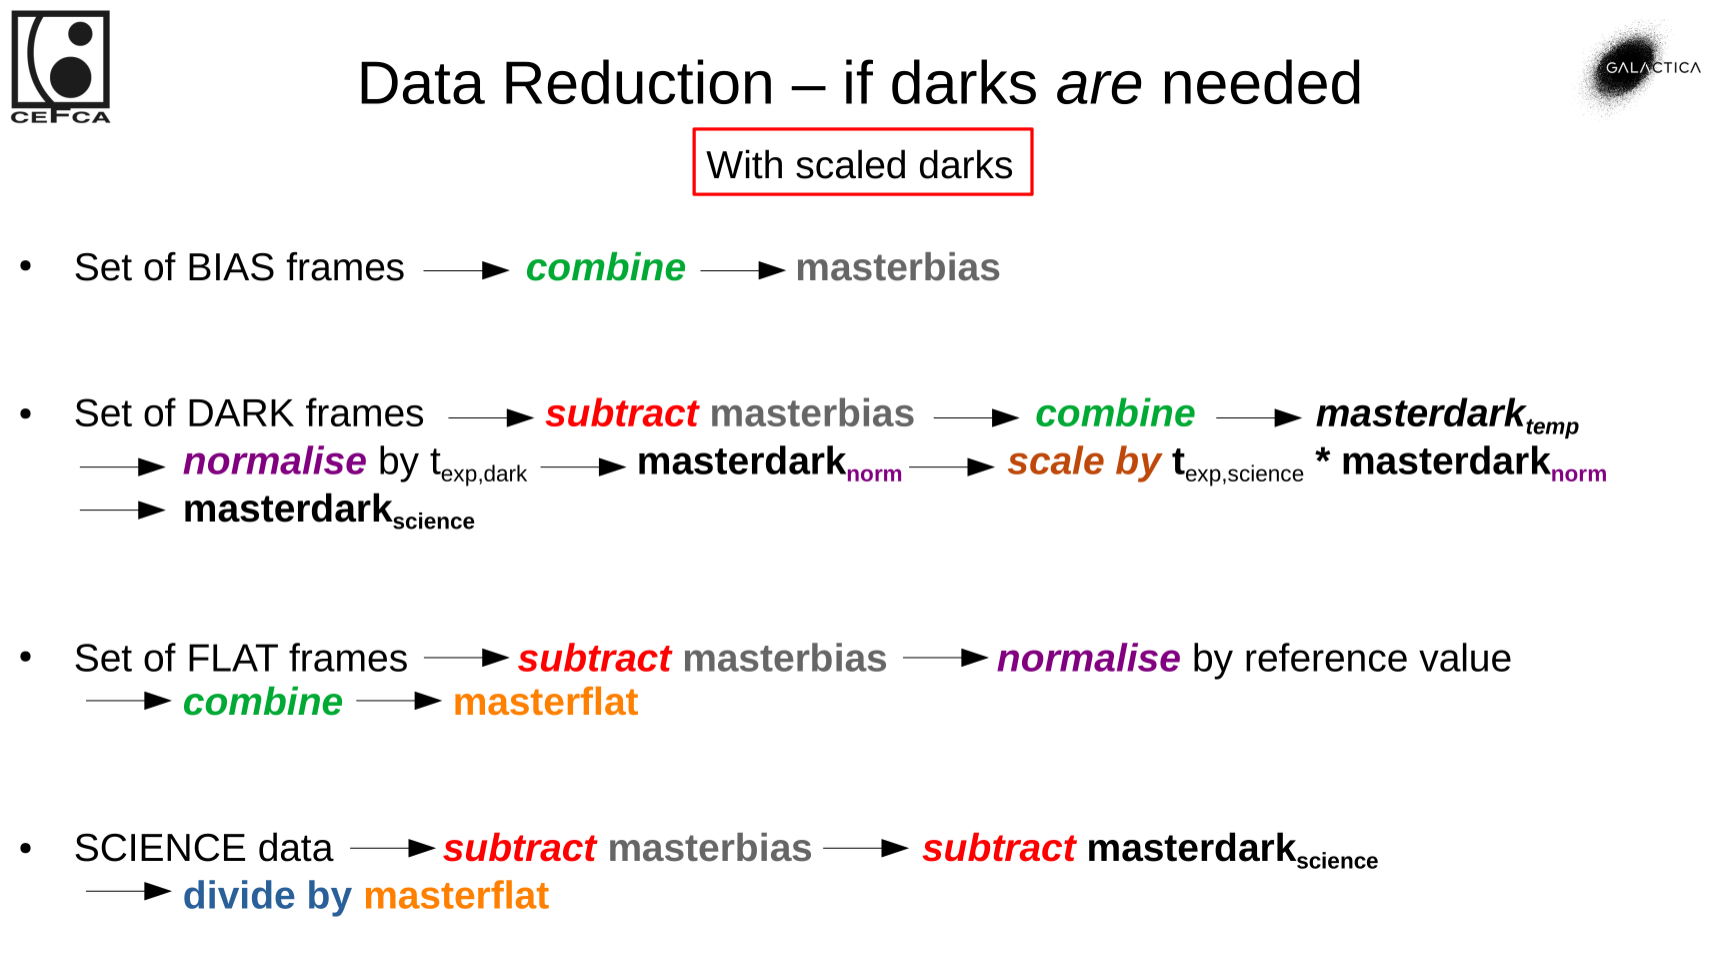
Scaled Dark frames:
obtain dark frames in one
and subtract the masterbias from each of these dark frames, combine them into a masterdark, and then normalise the masterdark, i.e. divide it by . This is a representation of pure dark signal (as we removed the bias) in 1 second. then we can scale this normalised masterdark to each of our science exposure times:
Flat:
normalisting each flat frame by dividing its mode value(the number appears most), and then combine.
each flat frame has its own reference value.
the whole process:
the basics of Photometry
- photometry: measure the total amount of ADU counts of the celestial object we are observing. (represent the amount of light)
get the ADU counts
Aperture photometry:
aperture:
- Object aperture: around our actual object of interest
- Inner sky annulus
- Outer sky annulus
the two annuli define a ring, where we can estimate the contribution of the sky background.
how to define the apertures? plot in radial
this can be draw by software AstroImageJ
The Airy disc: point source turn to disc due to diffraction
the radius of the Airy disc
Astronomical seeing: due to the turbulence of atmosphere
Aperture Photometry process:
- Raw object flux,
- Sky flux,
- Final object flux,
where is the number of pixels contained in the object aperture
- Raw object flux,
Signal to Noise Ratio:
from counts to magnitudes
instrumental magnitude,
zeropoint magnitude,
is the apparent magnitude of a star that, when observed with our CCD, gives 1 ADU/sec. the apparent magnitude of a star that, when observed with our CCD, has instrumental magnitude
the equation convert instrumental magnitude to apparent magnitude:
Measuring the zeropoint (using standard stars)
the atmosphere extinction
under atmosphere plane parallel approximation
the magnitude outside of the atmosphere the observed magnitude airmass the zenith distance (or altitude) atmosphere extinction standard stars (also called photometric or spectrophotometric standard stars, SPS stars)
the process:
- observe at different airmass
- perform photometry, obtain instrumental magnitudes
- plot airmass versus instrumental magnitudes and fit a straight line (
)
so we get the
and for standard stars, its apparent magnitude is known, and the zero point
estimating the zeropoint (using external catalogues)
use catalogues to calibrate our own photometry, the steps:
- use a arbitrary value for
to obtain apparent magnitudes - crossmatch and obtain their calibrated apparent magnitudes,
- calculate the difference
- repeat and obtain average (or median)
finally we have
- use a arbitrary value for
gaiaxpy
lecture 5: time-domain
Time-domain Astronomy
Light curve
timestamp
light curve: magnitudes-time or magnitudes-phase
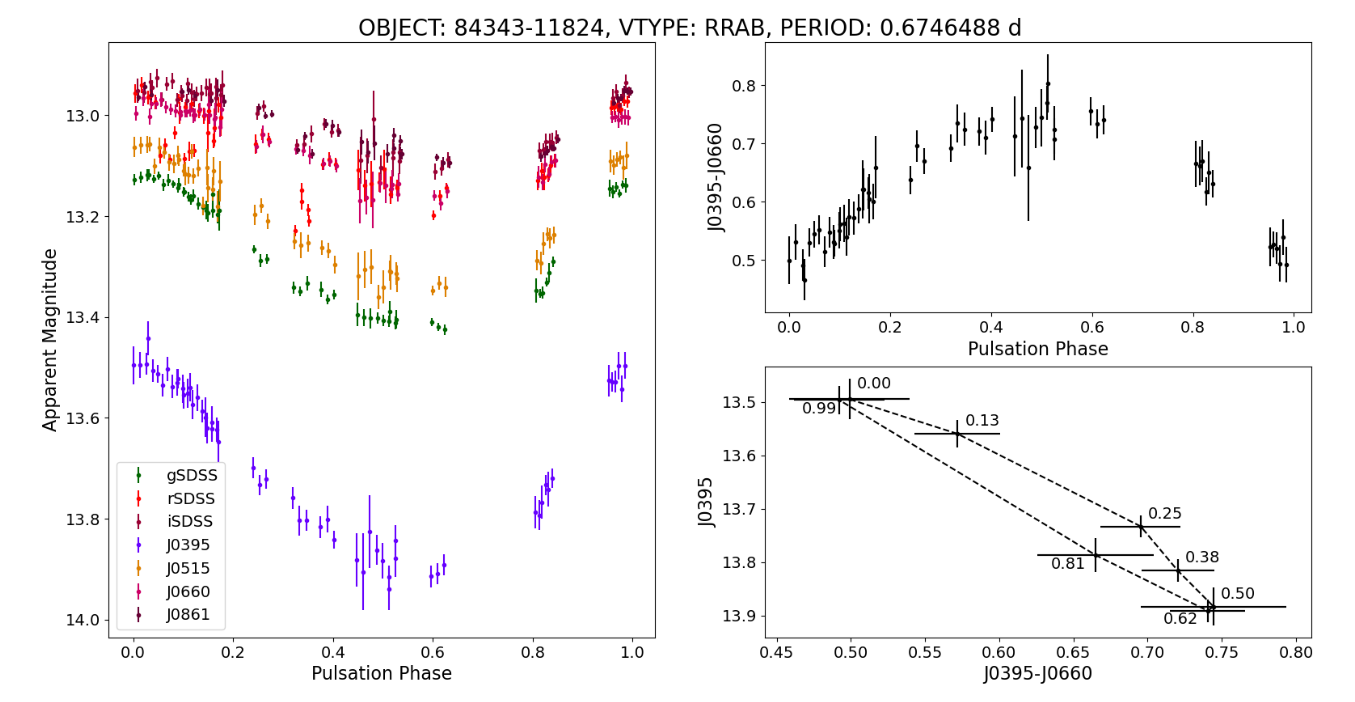
variable star types:
Intrinsic Variables: change in Luminosity due to a change in
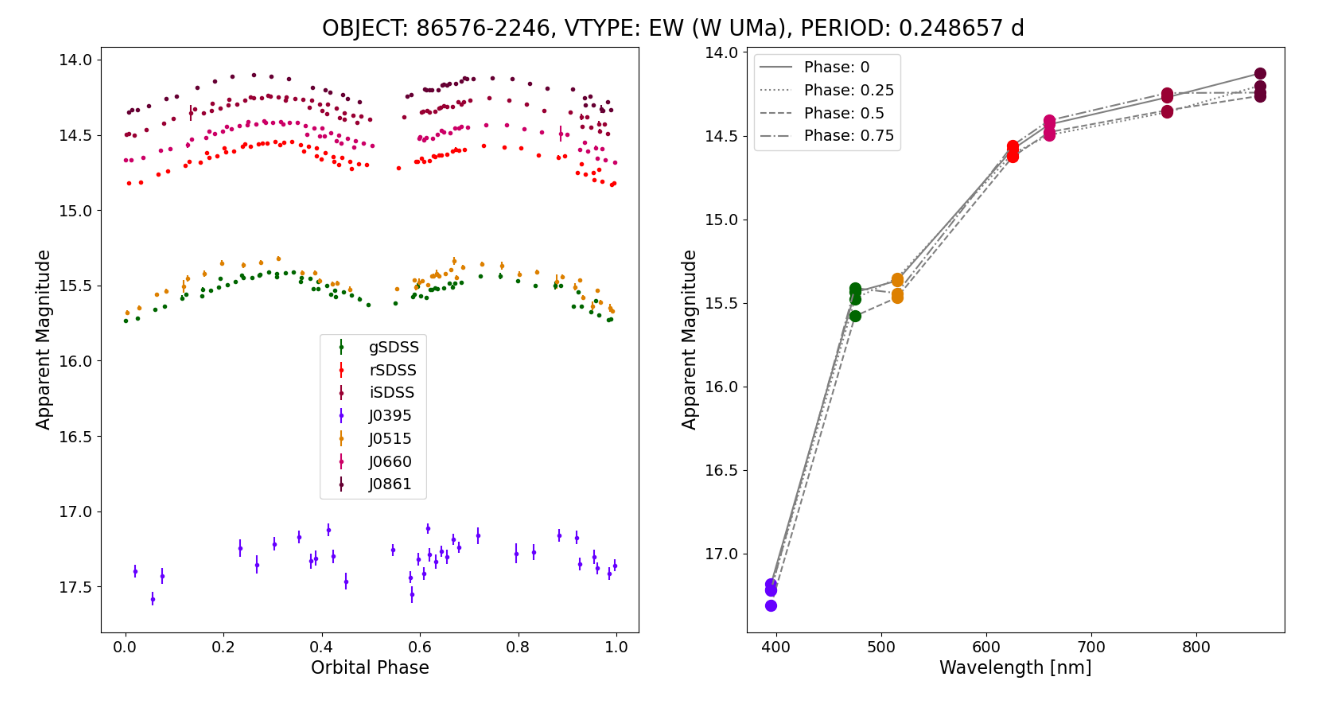
and/or , e.g. pulsating stars like delta-Scuti, RR-Lyrae and Cepheids Extrinsic Variables: change in Brightness due to "outside" influence e.g. eclipsing binaries.
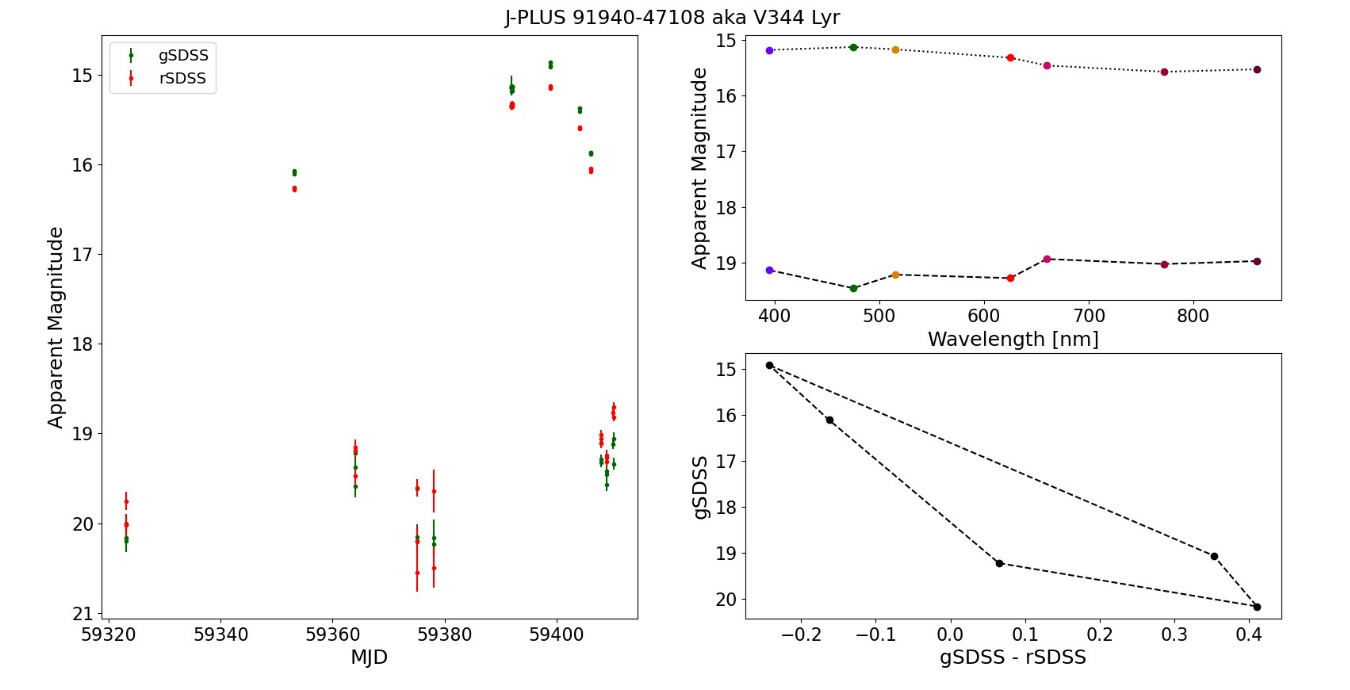
Transients: basically things like Super Novae, Classical Novae, Cataclysmic Variables, flare stars etc...
Why study Variable Stars?
- Cepheid Variables: period-luminosity relation, standard candles for distance measurements (
) - Plusating Stars: asteroseismology (the earthquake on star), study of stellar interior structure
- Eclipsing systems: model-independent measurements of stellar masses and radii
- Flare Stars: stellar spots, magnetic field activity
- Cataclysmic Variables: study of accretion processes
- Cepheid Variables: period-luminosity relation, standard candles for distance measurements (
Differential photometry:
use the light curve of one star to correct the light curve of another by plotting the difference of the magnitudes.
Ensemble differential photometry:
use multiple comparison stars.
normalise them first (subtract the median)
The J-VAR survey
practice 1
light curve of variables
basic
.fit(s)
header (file-header in SAOImageDS9)
SIMBAD: the database to search variables
the website: https://simbad.cds.unistra.fr/simbad/
Otype: the name with the * means a variable
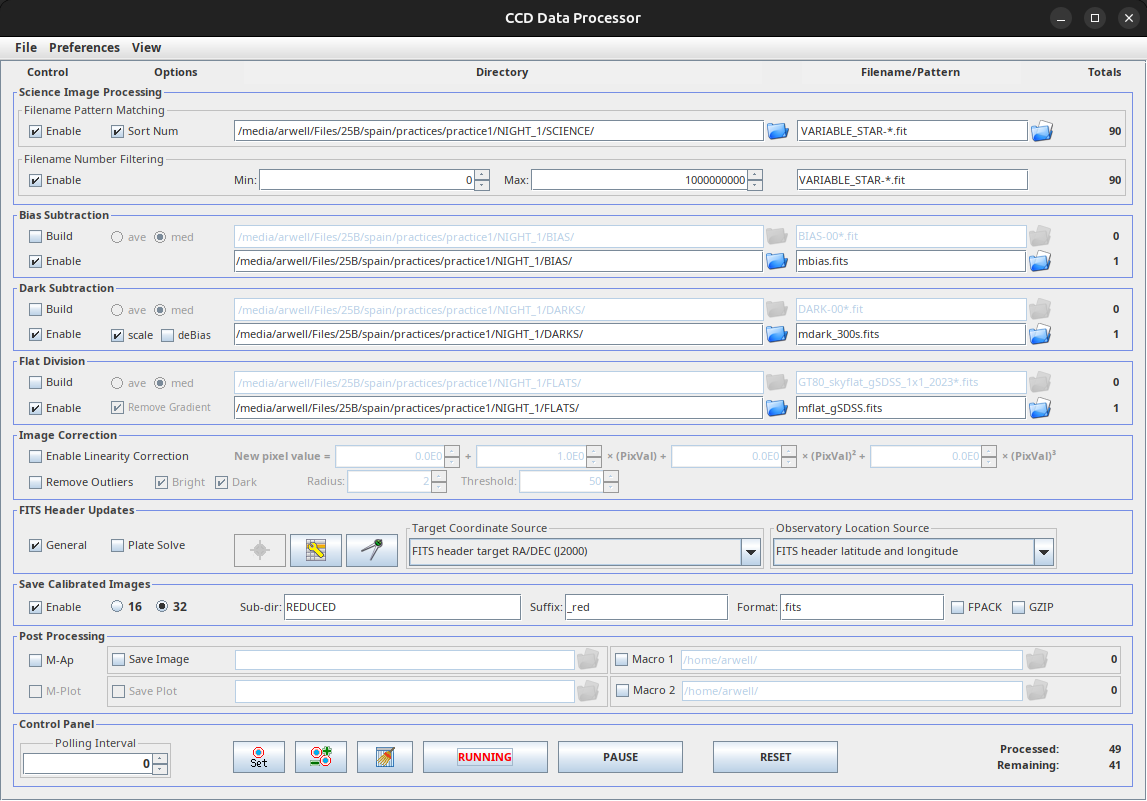
data reduction using AstroImageJ
click the Data Processor button DP (obtain the "CCD Data Processor" window)
create the masterbias frame:
set up the directory of bias frames and the filename pattern "*.fit"
set up the directory of output masterbias frame and the filename like "mbias.fit"
click the "start" button after finishing set up
create the masterdark frame:
the similar set up directory above
"Enable" the Bias Subtraction, and select the "deBias" option
create the masterflat frame:
remember to contain the filter information in the output filename.
reducing the science images:
make sure that the selected flat frame matches the filter of the science images
aperture photometry
- decide the size of aperture using radial profile
light curve
"File" -> "Import" -> "Image Sequence"
multi-apertures:
choose the reference star:
- const star
- no saturation
- no too faint
- different reference star for different filters
above we just get the flux(ADU counts), we need to get magnitude-phase next.
turn time-domain to phase-domain:
Ephemeris:
and then you can get the phase
convert ADU flux to magnitude:
where
is the catalogue magnitude of the i-th comparison star. the catalogue that can search the magnitude is on: https://catalogs.mast.stsci.edu/panstarrs/
getting the magnitude error
normalize the light curve by dividing the average/mean
practice 2
open clusters
usual reduction
using AstroImageJ:
select target stars (no comparsion stars)
get only data at a fixed time (no time domain)
the gaints saturate, the solution:
take different picture with different exposure times
the color in H-R diagram(from blue to red):
g-r, g-i, r-i
usually, we take g vs g-r, g vs g-i, r vs r-i as coordinate
error propagation
error propagation: the process to correctly calculate the error while convert counts to instrumental magnitudes.
the general formula:
for single variable,
for the instrumental magnitude:
for multiple variables,
for the colour index g-r,
identify
using both parallax(distance) and proper motion to check if the target stars is belong to our clusters.
interstellar extinction
our observed color
has color excess , to obtain the real color: get real magnitudes:
- find
in catalog; - get constant
while in the Table 6 in paper; for each filters(g,r,i)
- find
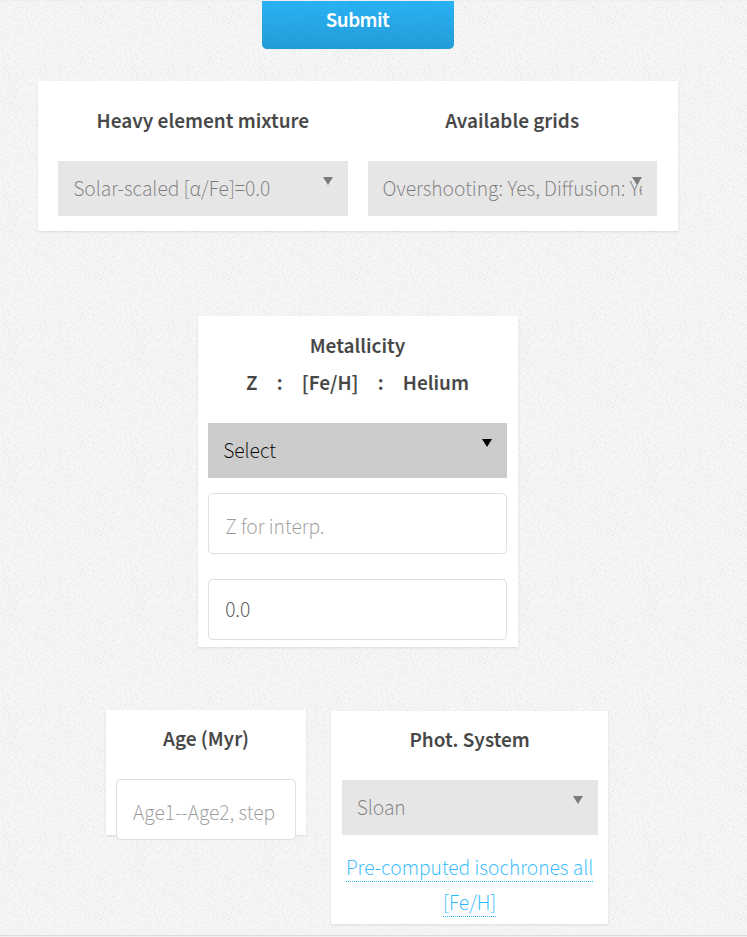
Isochrone
the database of Isochrone BaSTI
the download options is shown below
Appendix
some useful website link: